
Home & analytics — illustrated tour
Illustrated Store performance guide: sales, channels, pipeline, top products, and live visitors — why each card matters for marketing and ops.
/dashboard is command center. Store performance shows net sales, revenue, orders, average order, items sold, and customers — plus a timeline chart, online vs POS channels, status pipeline, and top products. Open it daily before you answer WhatsApp.
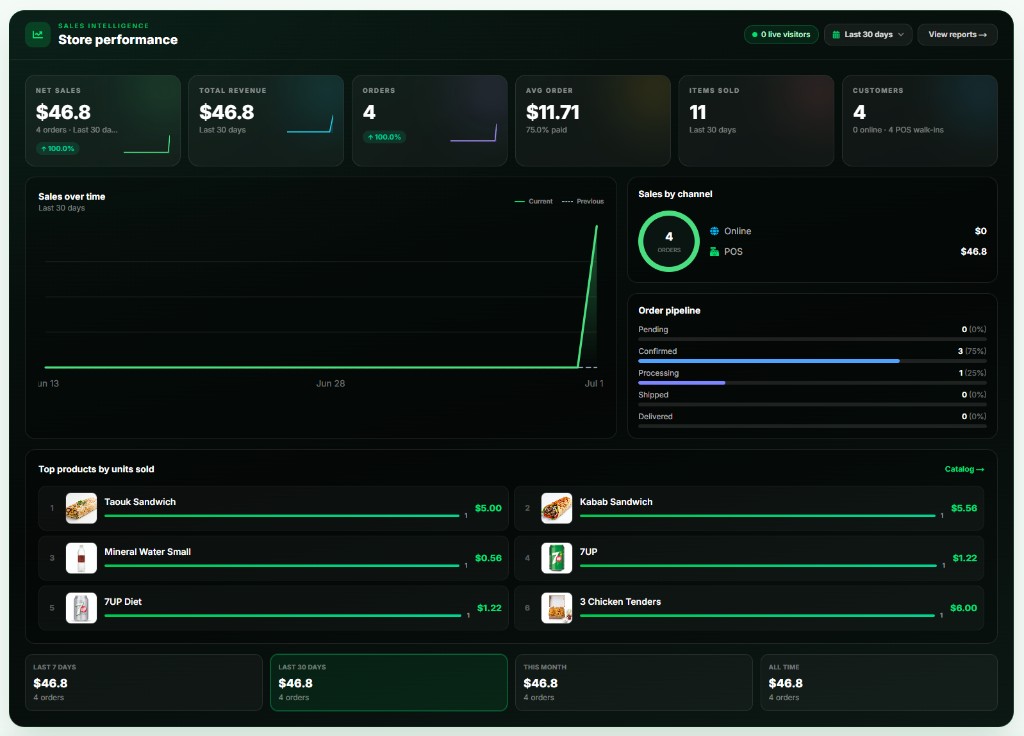
Store performance — food / restaurant example
The same board serves any business. In the food example you see POS walk-in sales, top sandwiches and drinks, and a sales spike chart — what happens when the counter sells from the same catalog.
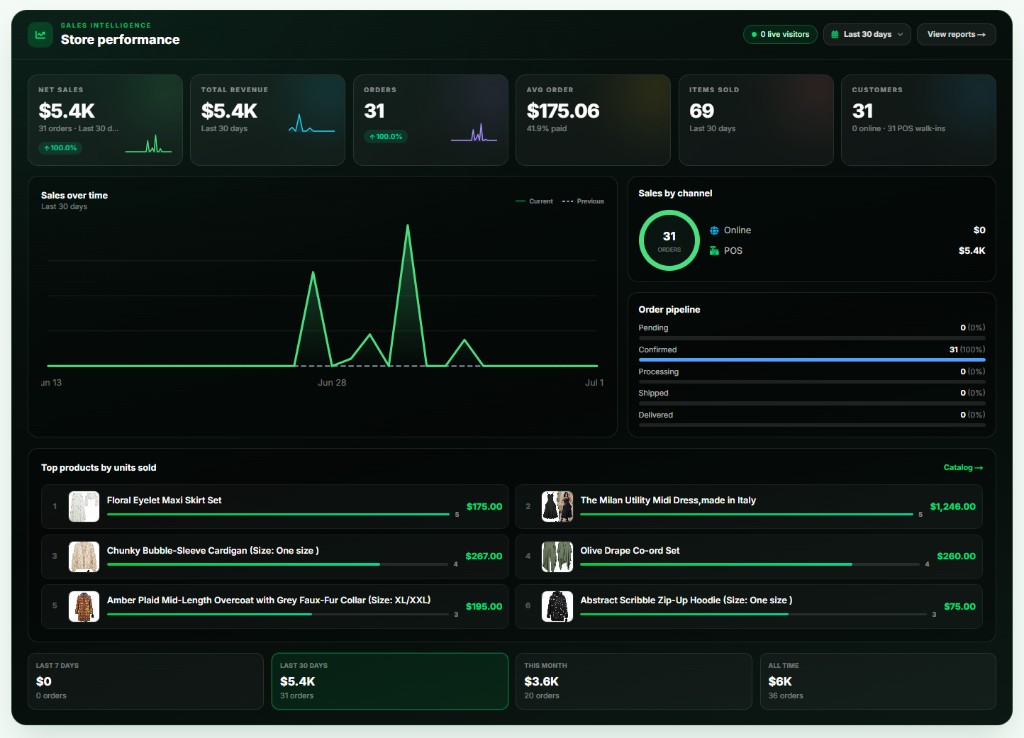
Store performance — fashion / retail example
Same structure with a fashion catalog: higher average order, product photos, and period cards (7 days / 30 days / month / all time). Message: restaurants and premium retail share the same intelligence.
Board header
- Live visitors
- Shoppers on the storefront now — “the store is alive”
- Period
- Last 7 / 30 days, this month, or all time
- View reports
- Jump to deeper reports / POS Today
The six metric cards
- Net Sales
- Net sales in the period + growth % and sparkline
- Total Revenue
- Total revenue shown
- Orders
- Order count (online and/or POS)
- Avg Order
- Average order value + % paid
- Items Sold
- Units sold — useful for stock planning
- Customers
- Period customers with online vs POS walk-ins
Charts, channels & pipeline
- Sales over time: current vs previous period — a clear spike is a marketing story
- Sales by channel: online vs POS — proves where money actually happens
- Order pipeline: Pending → Confirmed → Processing → Shipped → Delivered
Top products
Ranked list with photos and value/units. Use it to reorder stock, plan promos, and spotlight bestsellers in stories and bio.
Period summary cards
- Last 7 days / Last 30 days / This month / All time
- The green-bordered card is the active period
- Switch the period up top to see growth or slowdown instantly
Alerts & routine
- Trial or subscription ending → /pricing
- Approaching product/media limits → delete or upgrade
- Quick links to add a product or open POS
When stats stay honest
Update order statuses as you go. If everything stays pending, the pipeline and numbers mislead you and delivery tracking breaks down.
NextNavigation & limits